2.3 Time series patterns
In describing these time series, we have used words such as “trend” and “seasonal” which need to be defined more carefully.
- Trend
- A trend exists when there is a long-term increase or decrease in the data. It does not have to be linear. Sometimes we will refer to a trend as “changing direction”, when it might go from an increasing trend to a decreasing trend. There is a trend in the antidiabetic drug sales data shown in Figure 2.2.
- Seasonal
- A seasonal pattern occurs when a time series is affected by seasonal factors such as the time of the year or the day of the week. Seasonality is always of a fixed and known frequency. The monthly sales of antidiabetic drugs above shows seasonality which is induced partly by the change in the cost of the drugs at the end of the calendar year.
- Cyclic
- A cycle occurs when the data exhibit rises and falls that are not of a fixed frequency. These fluctuations are usually due to economic conditions, and are often related to the “business cycle”. The duration of these fluctuations is usually at least 2 years.
Many people confuse cyclic behaviour with seasonal behaviour, but they are really quite different. If the fluctuations are not of a fixed frequency then they are cyclic; if the frequency is unchanging and associated with some aspect of the calendar, then the pattern is seasonal. In general, the average length of cycles is longer than the length of a seasonal pattern, and the magnitudes of cycles tend to be more variable than the magnitudes of seasonal patterns. Cycles and seasonality are discussed further in Section 6.1.
Many time series include trend, cycles and seasonality. When choosing a forecasting method, we will first need to identify the time series patterns in the data, and then choose a method that is able to capture the patterns properly.
The following four examples show different combinations of the above components.
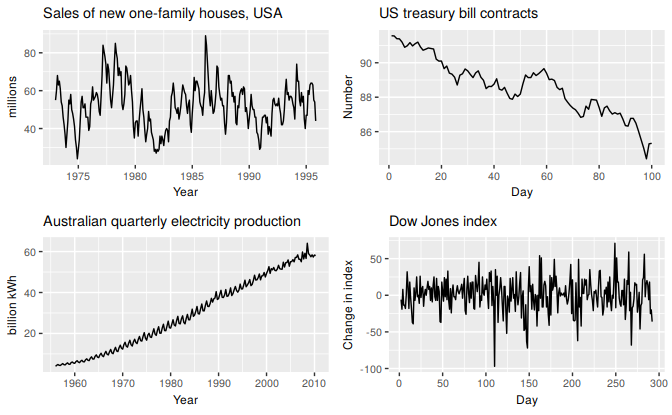
Figure 2.3: Four examples of time series showing different patterns.
The monthly housing sales (top left) show strong seasonality within each year, as well as some strong cyclic behaviour with a period of about 6–10 years. There is no apparent trend in the data over this period.
The US treasury bill contracts (top right) show results from the Chicago market for 100 consecutive trading days in 1981. Here there is no seasonality, but an obvious downward trend. Possibly, if we had a much longer series, we would see that this downward trend is actually part of a long cycle, but when viewed over only 100 days it appears to be a trend.
The Australian monthly electricity production (bottom left) shows a strong increasing trend, with strong seasonality. There is no evidence of any cyclic behaviour here.
The daily change in the Dow Jones index (bottom right) has no trend, seasonality or cyclic behaviour. There are random fluctuations which do not appear to be very predictable, and no strong patterns that would help with developing a forecasting model.