4.7 Judgmental adjustments
In this final section, we consider the situation where historical data are available and are used to generate statistical forecasts. It is common for practitioners to then apply judgmental adjustments to these forecasts. These adjustments can potentially provide all of the advantages of judgmental forecasting which have been discussed earlier in this chapter. For example, they provide an avenue for incorporating factors that may not be accounted for in the statistical model, such as promotions, large sporting events, holidays, or recent events that are not yet reflected in the data. However, these advantages come to fruition only when the right conditions are present. Judgmental adjustments, like judgmental forecasts, come with biases and limitations, and we must implement methodical strategies in order to minimise them.
Use adjustments sparingly
Practitioners adjust much more often than they should, and many times for the wrong reasons. By adjusting statistical forecasts, users of forecasts create a feeling of ownership and credibility. Users often do not understand or appreciate the mechanisms that generate the statistical forecasts (as they will usually have no training in this area). By implementing judgmental adjustments, users feel that they have contributed to and completed the forecasts, and they can now relate their own intuition and interpretations to these. The forecasts have become their own.
Judgmental adjustments should not aim to correct for a systematic pattern in the data that is thought to have been missed by the statistical model. This has been proven to be ineffective, as forecasters tend to read non-existent patterns in noisy series. Statistical models are much better at taking account of data patterns, and judgmental adjustments only hinder accuracy.
Judgmental adjustments are most effective when there is significant additional information at hand or strong evidence of the need for an adjustment. We should only adjust when we have important extra information which is not incorporated in the statistical model. Hence, adjustments seem to be most accurate when they are large in size. Small adjustments (especially in the positive direction promoting the illusion of optimism) have been found to hinder accuracy, and should be avoided.
Apply a structured approach
Using a structured and systematic approach will improve the accuracy of judgmental adjustments. Following the key principles outlined in Section @ref(sec-3-Key principles) is vital. In particular, having to document and justify adjustments will make it more challenging to override the statistical forecasts, and will guard against unnecessary adjustments.
It is common for adjustments to be implemented by a panel (see the example that follows). Using a Delphi setting carries great advantages. However, if adjustments are implemented in a group meeting, it is wise to consider the forecasts of key markets or products first, as panel members will get tired during this process. Fewer adjustments tend to be made as the meeting goes on through the day.
Example: Tourism Forecasting Committee (TFC)
Tourism Australia publishes forecasts for all aspects of Australian tourism twice a year. The published forecasts are generated by the TFC, an independent body which comprises experts from various government and private industry sectors; for example, the Australian Commonwealth Treasury, airline companies, consulting firms, banking sector companies, and tourism bodies.
The forecasting methodology applied is an iterative process. First, model-based statistical forecasts are generated by the forecasting unit within Tourism Australia, then judgmental adjustments are made to these in two rounds. In the first round, the TFC Technical Committee11 (comprising senior researchers, economists and independent advisors) adjusts the model-based forecasts. In the second and final round, the TFC (comprising industry and government experts) makes final adjustments. In both rounds, adjustments are made by consensus.
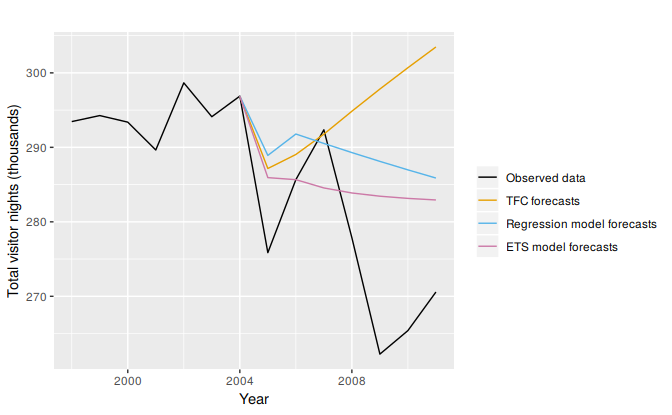
Figure 4.1: Long run annual forecasts for domestic visitor nights for Australia. We study regression models in Chapter 5, and ETS (ExponenTial Smoothing) models in Chapter 7.
In 2008, we (Athanasopoulos and Hyndman 2008) analysed forecasts for Australian domestic tourism. We concluded that the published TFC forecasts were optimistic, especially for the long-run, and we proposed alternative model-based forecasts. We now have access to observed data up to and including 2011. In Figure , we plot the published forecasts against the actual data. We can see that the published TFC forecasts have continued to be optimistic.
What can we learn from this example? Although the TFC clearly states in its methodology that it produces ‘forecasts’ rather than ‘targets’, could this be a case where these have been confused? Are the forecasters and users sufficiently well-segregated in this process? Could the iterative process itself be improved? Could the adjustment process in the meetings be improved? Could it be that the group meetings have promoted optimism? Could it be that domestic tourism should have been considered earlier in the day?
References
Athanasopoulos, George, and Rob J Hyndman. 2008. “Modelling and Forecasting Australian Domestic Tourism.” Tourism Management 29 (1): 19–31.
GA was an observor on this technical committee for a few years.↩