2.5 Seasonal subseries plots
An alternative plot that emphasises the seasonal patterns is where the data for each season are collected together in separate mini time plots.
ggsubseriesplot(a10) + ylab("$ million") +
  ggtitle("Seasonal subseries plot: antidiabetic drug sales")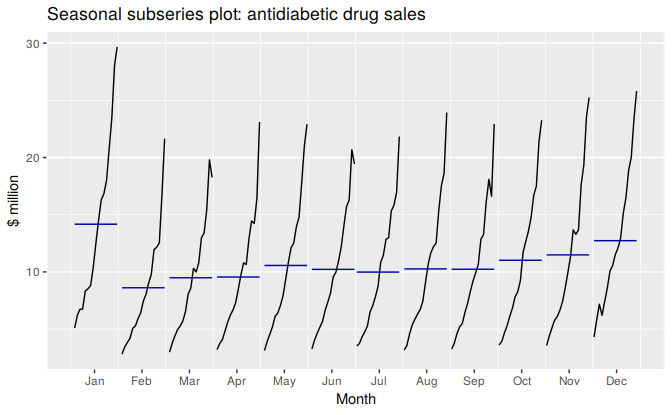
Figure 2.6: Seasonal subseries plot of monthly antidiabetic drug sales in Australia.
The horizontal lines indicate the means for each month. This form of plot enables the underlying seasonal pattern to be seen clearly, and also shows the changes in seasonality over time. It is especially useful in identifying changes within particular seasons. In this example, the plot is not particularly revealing; but in some cases, this is the most useful way of viewing seasonal changes over time.