Error vs step size with Euler method
Alfonso R. Reyes
2017-11-10
A challenge
Given the differential equation:
\[ \frac {dy} {dx} = x + y \]
Use the Euler ODE solver to find the error between the exact solution given by:
\[ y(x) = e^e - x - 1\]
at these step sizes: 1, 0.5, 0.25, 0.1, 0.01, 0.001, 0.0001; and plot the the step size versus the error when the \(x = 1\).
Build the ODE solver
library(rODE)
library(ggplot2)

setClass("EulerError", slots = c(
    stack = "environment"           # environment object inside the class
    ),
    contains = c("ODE")
    )

setMethod("initialize", "EulerError", function(.Object, ...) {
    .Object@stack$n <-  0               # "n" belongs to the class environment
    .Object@state   <- vector("numeric", 1)
    return(.Object)
})

setMethod("getExactSolution", "EulerError", function(object, t, ...) {
    # analytical solution
    return(exp(t) - t - 1)
})

setMethod("getState", "EulerError", function(object, ...) {
    object@state
})

setMethod("getRate", "EulerError", function(object, state, ...) {
    object@rate[1] <- state[1] + state[2]      # x + y
    object@rate[2] <- 1                        # dx/dx
    object@stack$n <- object@stack$n + 1       # add 1 to the rate count
    object@rate
})

# constructor
EulerError <- function(y) {
    .EulerError <- new("EulerError")
    .EulerError@state[1] = y        # y
    .EulerError@state[2] = 0        # x = t
    return(.EulerError)
}
## [1] "initialize"
## [1] "getExactSolution"
## [1] "getState"
## [1] "getRate"# class implementation
EulerErrorApp <- function(stepSize = 0.1) {
initial_y <- 0
xmax <- 1
stepSize <- stepSize
n_steps <- as.integer((xmax + stepSize / 2) / stepSize)
ode <- EulerError(initial_y)
ode_solver <- Euler(ode)
ode_solver <- setStepSize(ode_solver, stepSize)
steps <- 0
rowVector <- vector("list")
i <- 1
while (steps < n_steps) {
ode_solver <- step(ode_solver)
state <- getState(ode_solver@ode)
steps <- ode_solver@ode@stack$n
rowVector[[i]] <- list(
x = state[2], # x = t
y = state[1], # y
TrueY = getExactSolution(ode_solver@ode, state[2]),
steps = steps)
i <- i + 1
}
data.table::rbindlist(rowVector)
}Calculate the error for each step size
# get the error at the last row of the dataframe
df <- EulerErrorApp(stepSize = 0.1)
last_row <- df[nrow(df),]
error <- (last_row$TrueY - last_row$y) / last_row$TrueY

# function that gets the error for different step sizes
get_error <- function(stepSize) {
    df <- EulerErrorApp(stepSize)
    last_row <- df[nrow(df),]
    error <- (last_row$TrueY - last_row$y) / last_row$TrueY
    c(step = stepSize, odeY = last_row$y ,TrueY = last_row$TrueY, error = error, n_steps = last_row$steps)
}

step_sizes <- c(1, 0.5, 0.25, 0.1, 0.01, 0.001, 0.0001)
errors <- data.frame(t(sapply(step_sizes, get_error)))
errors
## step odeY TrueY error n_steps
## 1 1.0000 0.0000000 0.7182818 1.0000000000 1
## 2 0.5000 0.2500000 0.7182818 0.6519472022 2
## 3 0.2500 0.4414062 0.7182818 0.3854692789 4
## 4 0.1000 0.5937425 0.7182818 0.1733851024 10
## 5 0.0100 0.7048138 0.7182818 0.0187502990 100
## 6 0.0010 0.7169239 0.7182818 0.0018904783 1000
## 7 0.0001 0.7181459 0.7182818 0.0001892038 10000Plot the errors vs step size
a <- ggplot(errors, aes(step_sizes, error)) +
 geom_point(na.rm = TRUE) +
    geom_line()+
 scale_x_log10(
   breaks = scales::trans_breaks("log10", function(x) 10^x),
   labels = scales::trans_format("log10", scales::math_format(10^.x))
 ) +
 scale_y_log10(
   breaks = scales::trans_breaks("log10", function(x) 10^x),
   labels = scales::trans_format("log10", scales::math_format(10^.x))
 ) +
 theme_bw()
a + annotation_logticks(sides = "lrbt") +
    theme(panel.grid.minor = element_blank())   # hide the minor grids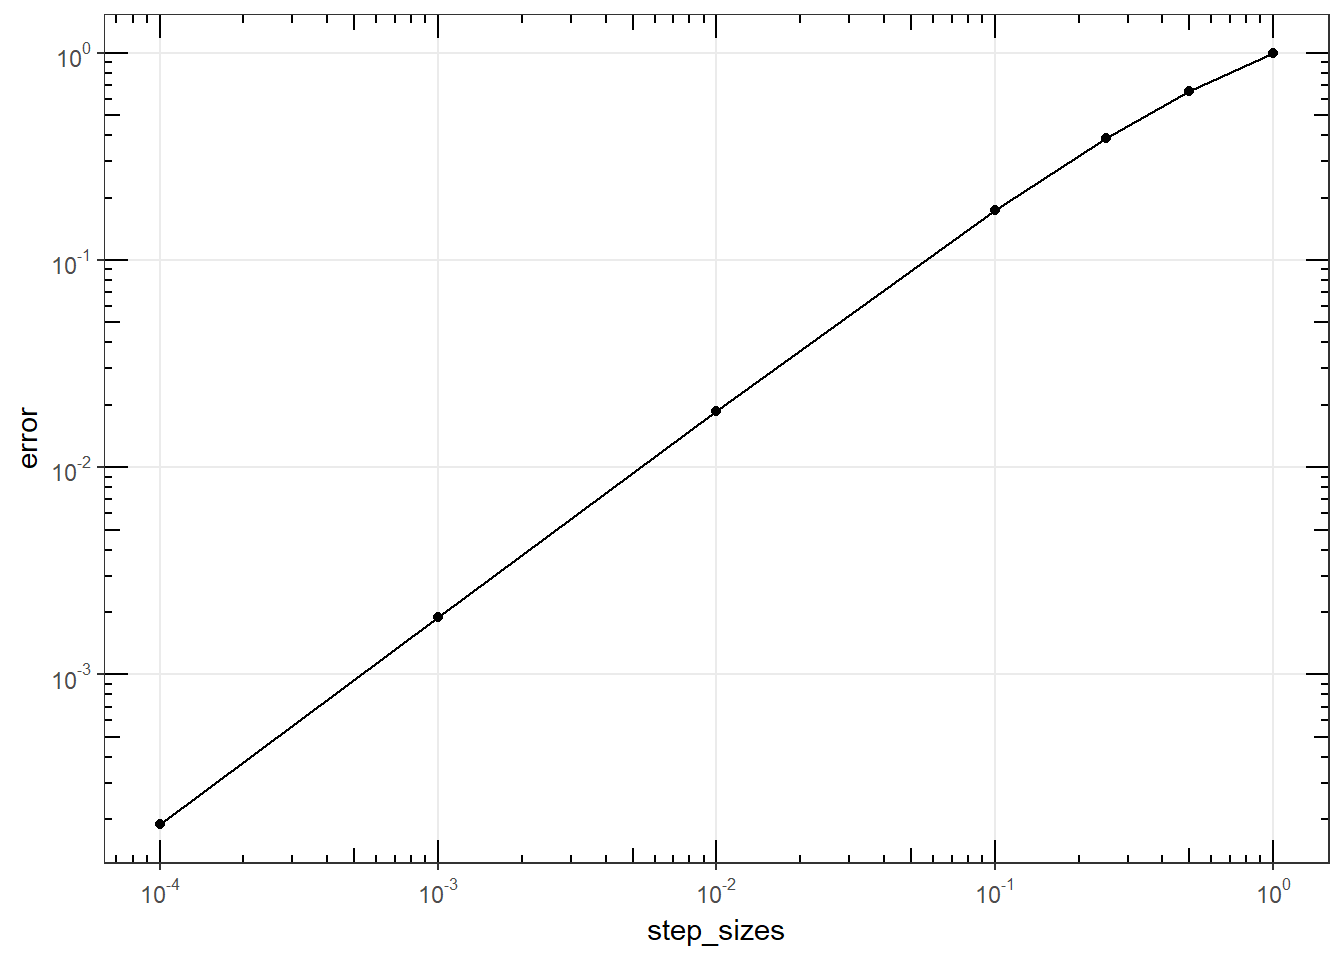
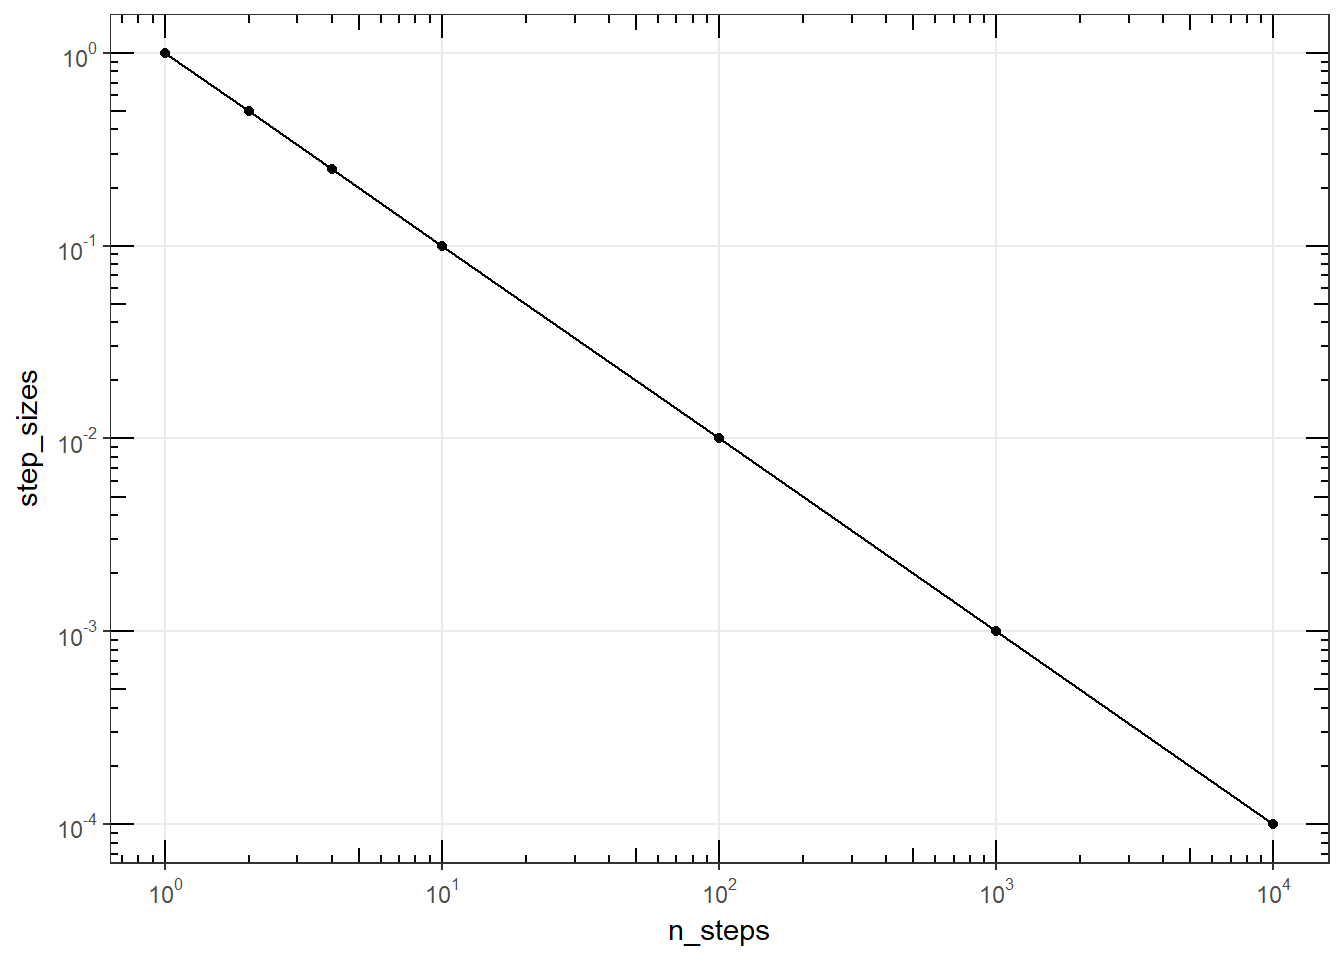
Plot the number of steps vs. step size
a <- ggplot(errors, aes(n_steps, step_sizes)) +
 geom_point(na.rm = TRUE) +
    geom_line()+
 scale_x_log10(
   breaks = scales::trans_breaks("log10", function(x) 10^x),
   labels = scales::trans_format("log10", scales::math_format(10^.x))
 ) +
 scale_y_log10(
   breaks = scales::trans_breaks("log10", function(x) 10^x),
   labels = scales::trans_format("log10", scales::math_format(10^.x))
 ) +
 theme_bw()
a + annotation_logticks(sides = "lrbt") +
    theme(panel.grid.minor = element_blank())   # hide the minor grids