Ch. 6 Voxels
Last update: Thu Nov 19 17:20:43 2020 -0600 (49b93b1)
R
library(reticulate)
# reticulate::use_condaenv("r-python")
reticulate::use_condaenv("pybook")
6.1 Radial
Python
# https://matplotlib.org/api/_as_gen/mpl_toolkits.mplot3d.axes3d.Axes3D.html
#=======================================================
#3D voxel / volumetric plot with cylindrical coordinates
#=======================================================
#Demonstrates using the ``x, y, z`` arguments of ``ax.voxels``.
import matplotlib.pyplot as plt
import matplotlib.colors
import numpy as np

# This import registers the 3D projection, but is otherwise unused.
from mpl_toolkits.mplot3d import Axes3D  # noqa: F401 unused import

def midpoints(x):
    sl = ()
    for i in range(x.ndim):
        x = (x[sl + np.index_exp[:-1]] + x[sl + np.index_exp[1:]]) / 2.0
        sl += np.index_exp[:]
    return x

# prepare some coordinates, and attach rgb values to each
r, theta, z = np.mgrid[0:1:11j, 0:np.pi*2:25j, -0.5:0.5:11j]
x = r*np.cos(theta)
y = r*np.sin(theta)

rc, thetac, zc = midpoints(r), midpoints(theta), midpoints(z)

# define a wobbly torus about [0.7, *, 0]
sphere = (rc - 0.7)**2 + (zc + 0.2*np.cos(thetac*2))**2 < 0.2**2
# combine the color components
hsv = np.zeros(sphere.shape + (3,))
hsv[..., 0] = thetac / (np.pi*2)
hsv[..., 1] = rc
hsv[..., 2] = zc + 0.5
colors = matplotlib.colors.hsv_to_rgb(hsv)
# and plot everything
fig = plt.figure()
ax = fig.gca(projection='3d')
ax.voxels(x, y, z, sphere,
          facecolors=colors,
          edgecolors=np.clip(2*colors - 0.5, 0, 1),  # brighter
          linewidth=0.5)
plt.show()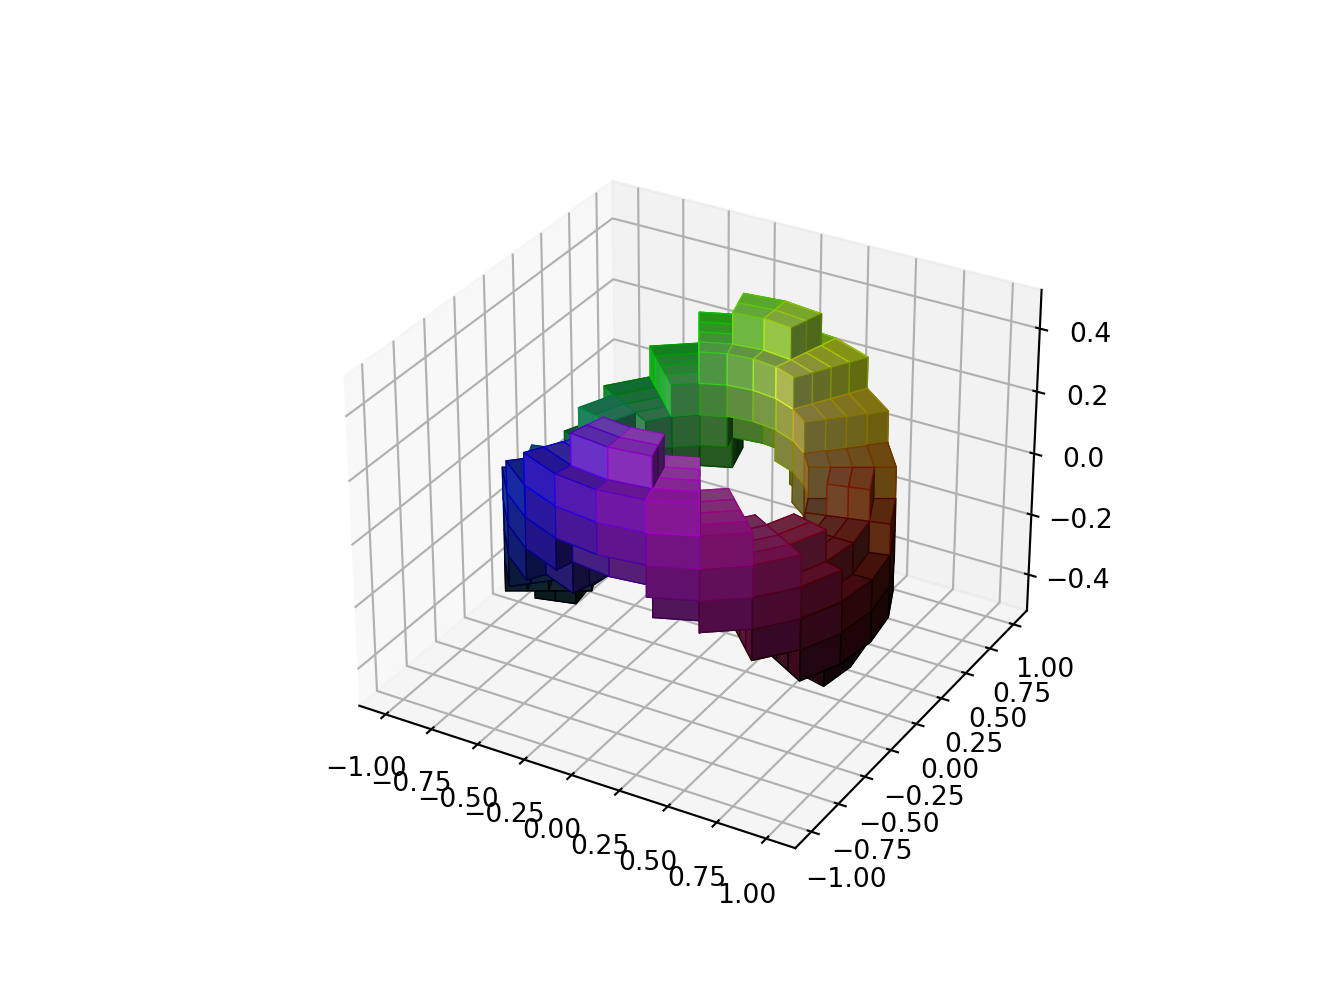
6.2 Spherical
Python
import matplotlib.pyplot as plt
import numpy as np

# This import registers the 3D projection, but is otherwise unused.
from mpl_toolkits.mplot3d import Axes3D  # noqa: F401 unused import


def midpoints(x):
    sl = ()
    for i in range(x.ndim):
        x = (x[sl + np.index_exp[:-1]] + x[sl + np.index_exp[1:]]) / 2.0
        sl += np.index_exp[:]
    return x

# prepare some coordinates, and attach rgb values to each
r, g, b = np.indices((17, 17, 17)) / 16.0
rc = midpoints(r)
gc = midpoints(g)
bc = midpoints(b)
# define a sphere about [0.5, 0.5, 0.5]
sphere = (rc - 0.5)**2 + (gc - 0.5)**2 + (bc - 0.5)**2 < 0.5**2
# combine the color components
colors = np.zeros(sphere.shape + (3,))
colors[..., 0] = rc
colors[..., 1] = gc
colors[..., 2] = bc
# and plot everything
fig = plt.figure()
ax = fig.gca(projection='3d')
ax.voxels(r, g, b, sphere,
          facecolors=colors,
          edgecolors=np.clip(2*colors - 0.5, 0, 1),  # brighter
          linewidth=0.5)
ax.set(xlabel='r', ylabel='g', zlabel='b')
plt.show()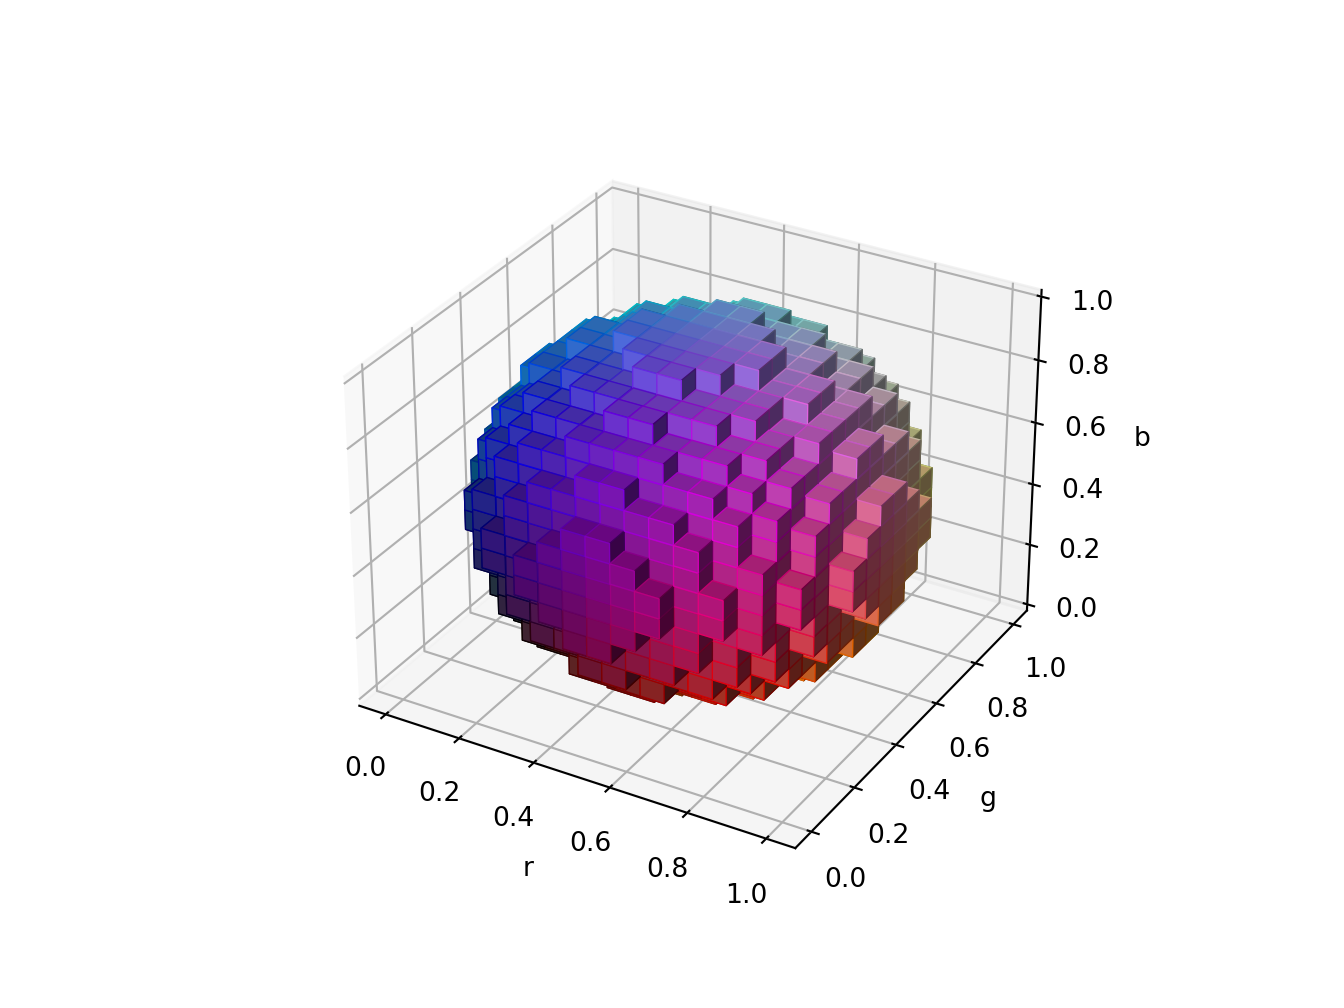
6.3 Solid cubes
Python
# https://github.com/matplotlib/matplotlib/blob/master/examples/mplot3d/voxels.py
import matplotlib.pyplot as plt
import numpy as np
# This import registers the 3D projection, but is otherwise unused.
from mpl_toolkits.mplot3d import Axes3D  # noqa: F401 unused import

# prepare some coordinates
x, y, z = np.indices((8, 8, 8))

# draw cuboids in the top left and bottom right corners, and a link between them
cube1 = (x < 3) & (y < 3) & (z < 3)
cube2 = (x >= 5) & (y >= 5) & (z >= 5)
link = abs(x - y) + abs(y - z) + abs(z - x) <= 2

# combine the objects into a single boolean array
voxels = cube1 | cube2 | link

# set the colors of each object
colors = np.empty(voxels.shape, dtype=object)
colors[link] = 'red'
colors[cube1] = 'blue'
colors[cube2] = 'green'

# and plot everything
fig = plt.figure()
ax = fig.gca(projection='3d')
ax.voxels(voxels, facecolors=colors, edgecolor='k')
plt.show()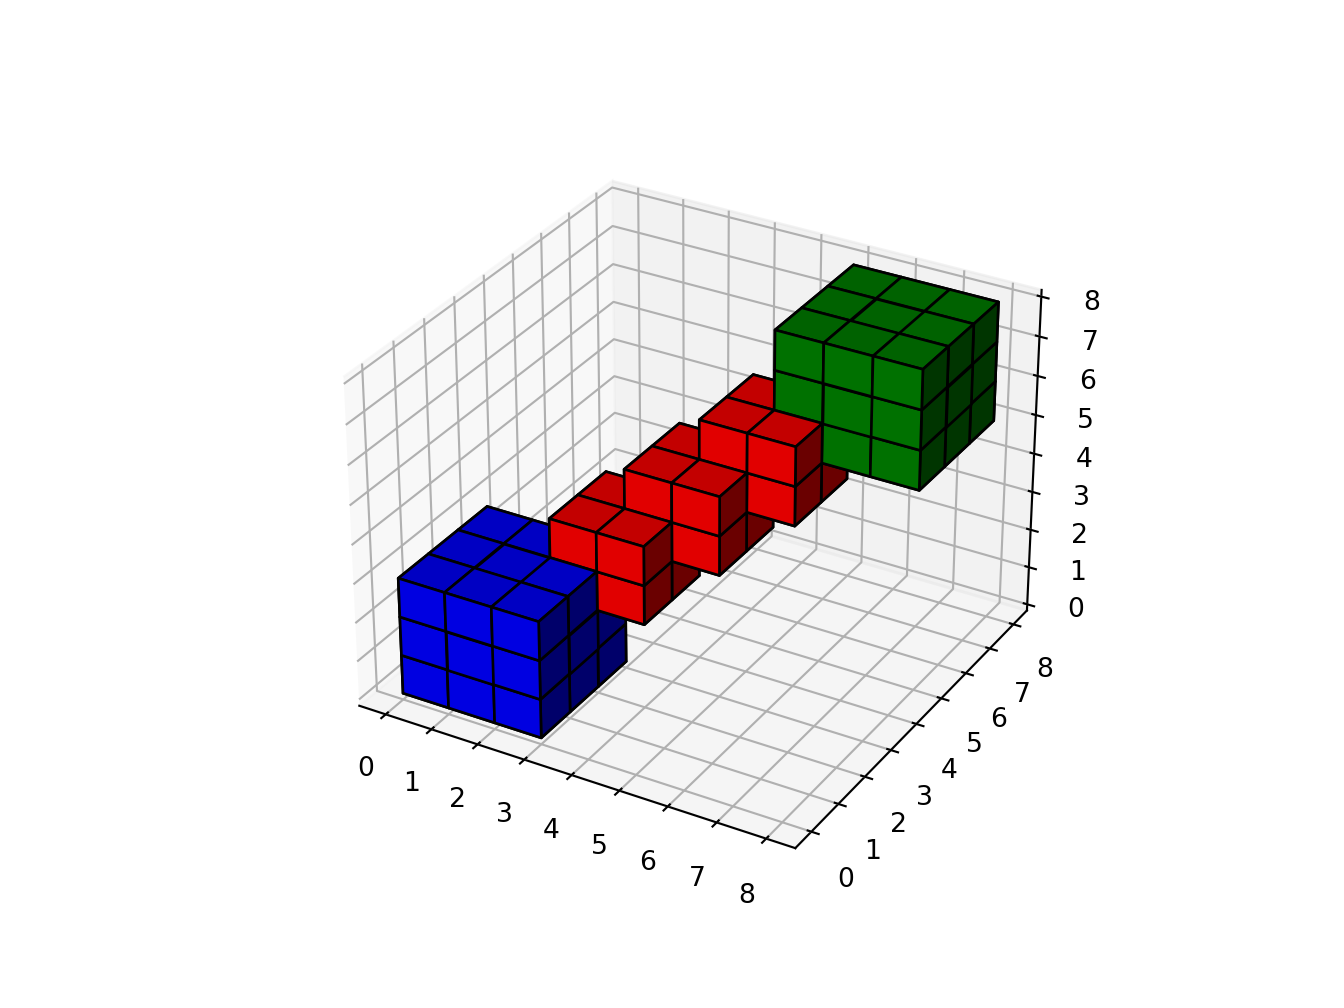
Python
# https://stackoverflow.com/a/49281004/5270873
from mpl_toolkits.mplot3d import Axes3D
from mpl_toolkits.mplot3d.art3d import Poly3DCollection
import numpy as np
import matplotlib.pyplot as plt


def cuboid_data2(o, size=(1,1,1)):
    X = [[[0, 1, 0], [0, 0, 0], [1, 0, 0], [1, 1, 0]],
         [[0, 0, 0], [0, 0, 1], [1, 0, 1], [1, 0, 0]],
         [[1, 0, 1], [1, 0, 0], [1, 1, 0], [1, 1, 1]],
         [[0, 0, 1], [0, 0, 0], [0, 1, 0], [0, 1, 1]],
         [[0, 1, 0], [0, 1, 1], [1, 1, 1], [1, 1, 0]],
         [[0, 1, 1], [0, 0, 1], [1, 0, 1], [1, 1, 1]]]
    X = np.array(X).astype(float)
    for i in range(3):
        X[:,:,i] *= size[i]
    X += np.array(o)
    return X

def plotCubeAt2(positions,sizes=None,colors=None, **kwargs):
    if not isinstance(colors,(list,np.ndarray)): colors=["C0"]*len(positions)
    if not isinstance(sizes,(list,np.ndarray)): sizes=[(1,1,1)]*len(positions)
    g = []
    for p,s,c in zip(positions,sizes,colors):
        g.append( cuboid_data2(p, size=s) )
    return Poly3DCollection(np.concatenate(g),
                            facecolors=np.repeat(colors,6), **kwargs)


positions = [(-3,5,-2),(1,7,1)]
sizes = [(4,5,3), (3,3,7)]
colors = ["crimson","limegreen"]

fig = plt.figure()
ax = fig.gca(projection='3d')
ax.set_aspect('auto')

pc = plotCubeAt2(positions,sizes,colors=colors, edgecolor="k")
ax.add_collection3d(pc)

ax.set_xlim([-4,6])
ax.set_ylim([4,13])
ax.set_zlim([-3,9])
plt.show()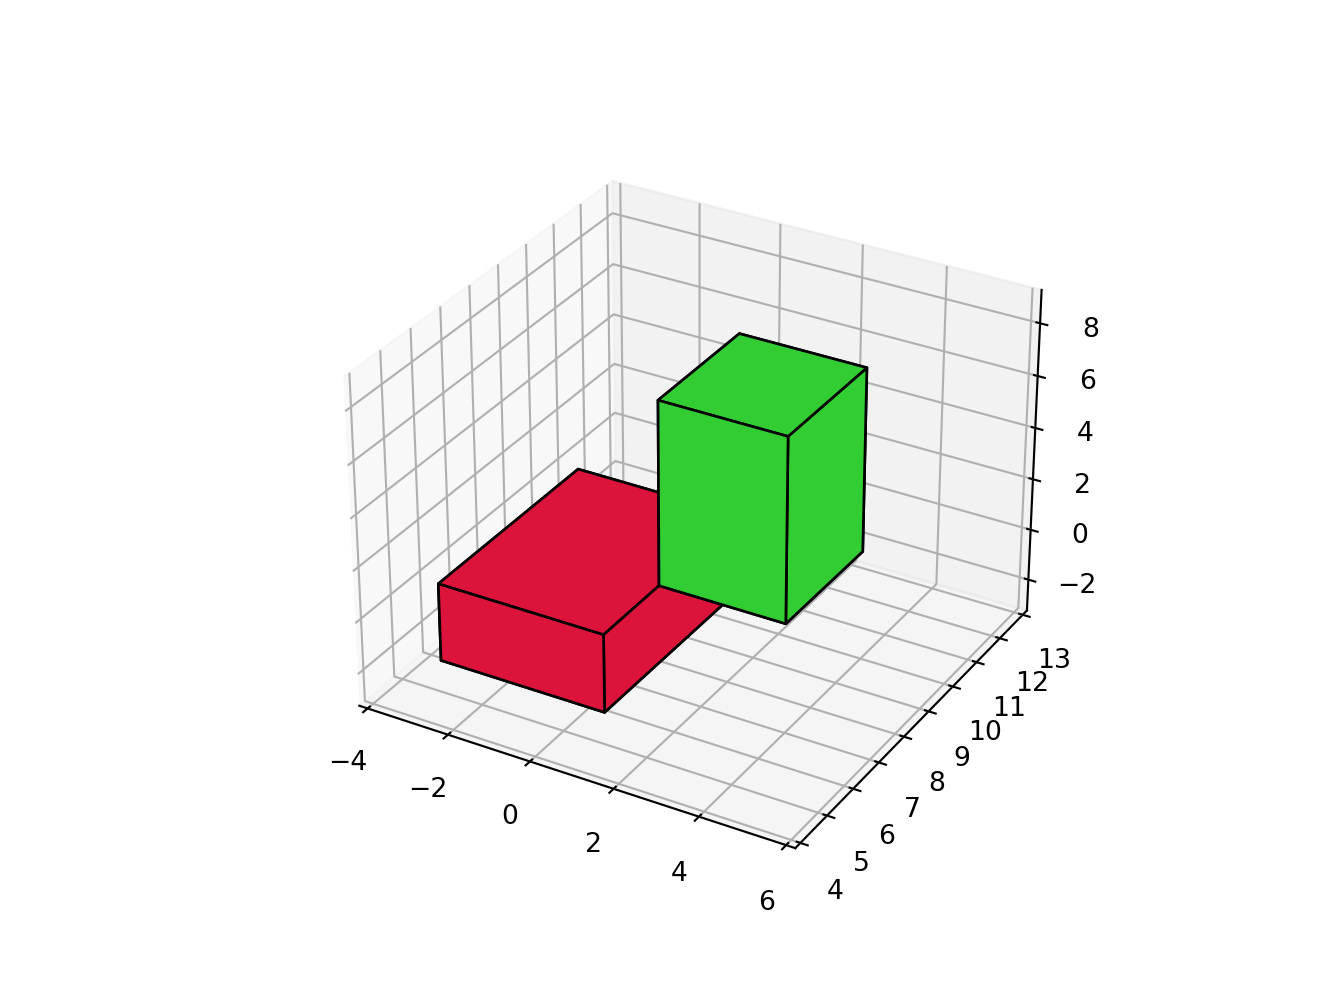
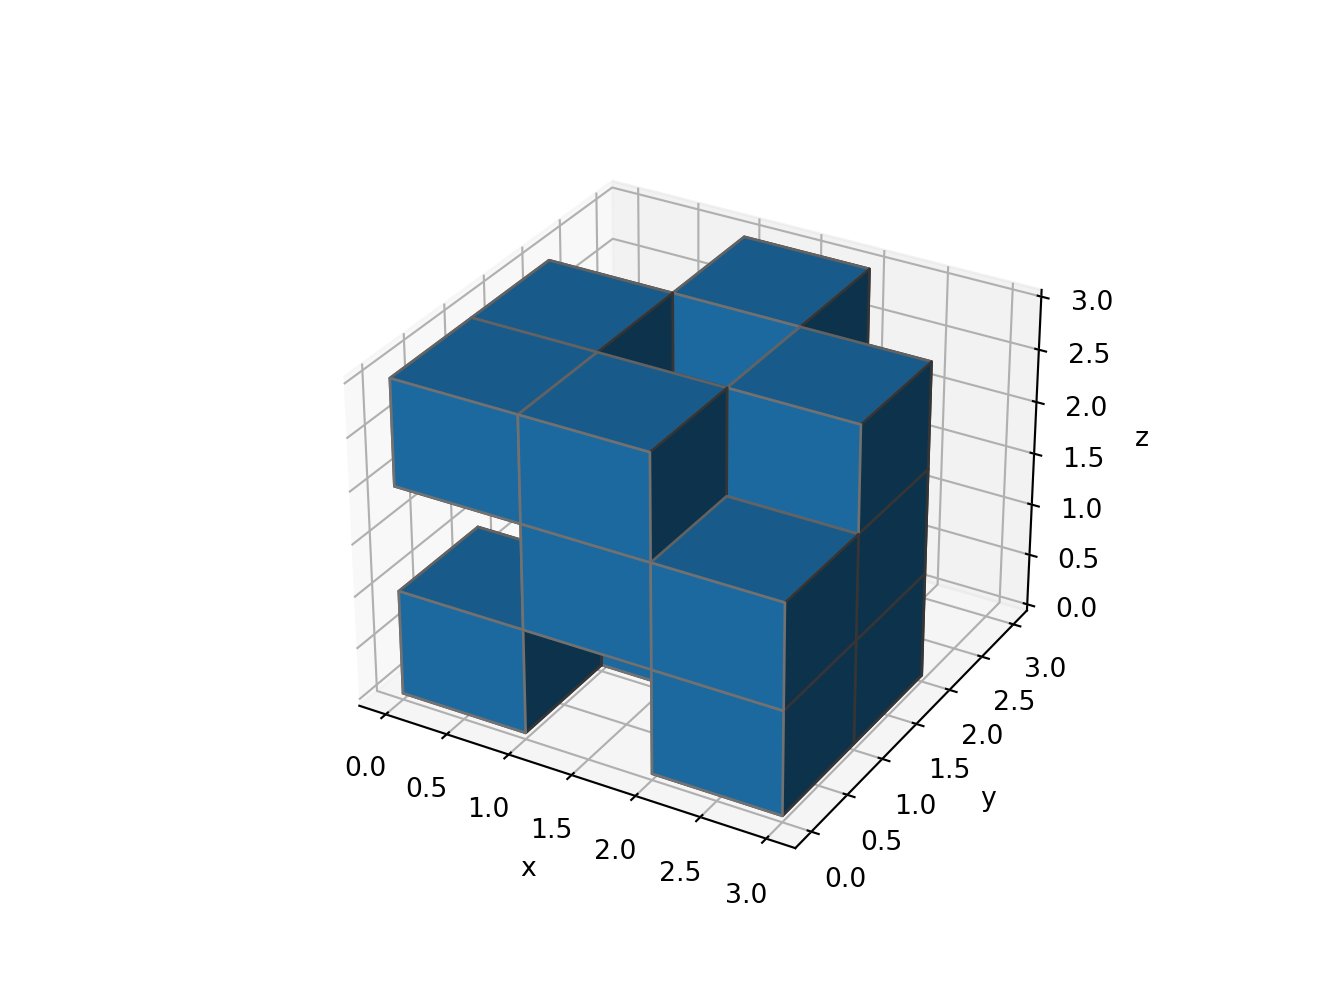
6.4 Transparent cubicles
Python
import numpy as np
import matplotlib.pyplot as plt
from mpl_toolkits.mplot3d import Axes3D

def make_ax(grid=False):
    fig = plt.figure()
    ax = fig.gca(projection='3d')
    ax.set_xlabel("x")
    ax.set_ylabel("y")
    ax.set_zlabel("z")
    ax.grid(grid)
    return ax

filled = np.array([
    [[1, 0, 1], [0, 0, 1], [0, 1, 0]],
    [[0, 1, 1], [1, 0, 0], [1, 0, 1]],
    [[1, 1, 0], [1, 1, 1], [0, 0, 0]]
])

def explode(data):
    shape_arr = np.array(data.shape)
    size = shape_arr[:3]*2 - 1
    exploded = np.zeros(np.concatenate([size, shape_arr[3:]]), dtype=data.dtype)
    exploded[::2, ::2, ::2] = data
    return exploded

def expand_coordinates(indices):
    x, y, z = indices
    x[1::2, :, :] += 1
    y[:, 1::2, :] += 1
    z[:, :, 1::2] += 1
    return x, y, z

ax = make_ax()
colors = np.array([[['#1f77b430']*3]*3]*3)
colors[1,1,1] = '#ff0000ff'
colors = explode(colors)
filled = explode(np.ones((3, 3, 3)))
x, y, z = expand_coordinates(np.indices(np.array(filled.shape) + 1))
ax.voxels(x, y, z, filled, facecolors=colors, edgecolors='gray')
plt.show()
Python
import numpy as np
import matplotlib.pyplot as plt
from mpl_toolkits.mplot3d import Axes3D

def make_ax(grid=False):
    fig = plt.figure()
    ax = fig.gca(projection='3d')
    ax.set_xlabel("x")
    ax.set_ylabel("y")
    ax.set_zlabel("z")
    ax.grid(grid)
    return ax

filled = np.array([
    [[1, 0, 1], [0, 0, 1], [0, 1, 0]],
    [[0, 1, 1], [1, 0, 0], [1, 0, 1]],
    [[1, 1, 0], [1, 1, 1], [0, 0, 0]]
])

ax = make_ax()
ax.voxels(filled, facecolors='#1f77b430', edgecolors='gray')
plt.show()
Python
import numpy as np
import matplotlib.pyplot as plt
from mpl_toolkits.mplot3d import Axes3D

def make_ax(grid=False):
    fig = plt.figure()
    ax = fig.gca(projection='3d')
    ax.set_xlabel("x")
    ax.set_ylabel("y")
    ax.set_zlabel("z")
    ax.grid(grid)
    return ax

filled = np.array([
    [[1, 0, 1], [0, 0, 1], [0, 1, 0]],
    [[0, 1, 1], [1, 0, 0], [1, 0, 1]],
    [[1, 1, 0], [1, 1, 1], [0, 0, 0]]
])

ax = make_ax()
ax.voxels(np.ones((3, 3, 3)), facecolors='#1f77b430', edgecolors='gray')
plt.show()
6.5 Semi-transparent
Python
# https://matplotlib.org/gallery/mplot3d/voxels_numpy_logo.html

import matplotlib.pyplot as plt
import numpy as np

# This import registers the 3D projection, but is otherwise unused.
from mpl_toolkits.mplot3d import Axes3D  # noqa: F401 unused import


def explode(data):
    size = np.array(data.shape)*2
    data_e = np.zeros(size - 1, dtype=data.dtype)
    data_e[::2, ::2, ::2] = data
    return data_e

# build up the numpy logo
n_voxels = np.zeros((4, 3, 4), dtype=bool)
n_voxels[0, 0, :] = True
n_voxels[-1, 0, :] = True
n_voxels[1, 0, 2] = True
n_voxels[2, 0, 1] = True
facecolors = np.where(n_voxels, '#FFD65DC0', '#7A88CCC0')
edgecolors = np.where(n_voxels, '#BFAB6E', '#7D84A6')
filled = np.ones(n_voxels.shape)

# upscale the above voxel image, leaving gaps
filled_2 = explode(filled)
fcolors_2 = explode(facecolors)
ecolors_2 = explode(edgecolors)

# Shrink the gaps
x, y, z = np.indices(np.array(filled_2.shape) + 1).astype(float) // 2
x[0::2, :, :] += 0.05
y[:, 0::2, :] += 0.05
z[:, :, 0::2] += 0.05
x[1::2, :, :] += 0.95
y[:, 1::2, :] += 0.95
z[:, :, 1::2] += 0.95

fig = plt.figure()
ax = fig.gca(projection='3d')
ax.voxels(x, y, z, filled_2, facecolors=fcolors_2, edgecolors=ecolors_2)
plt.show()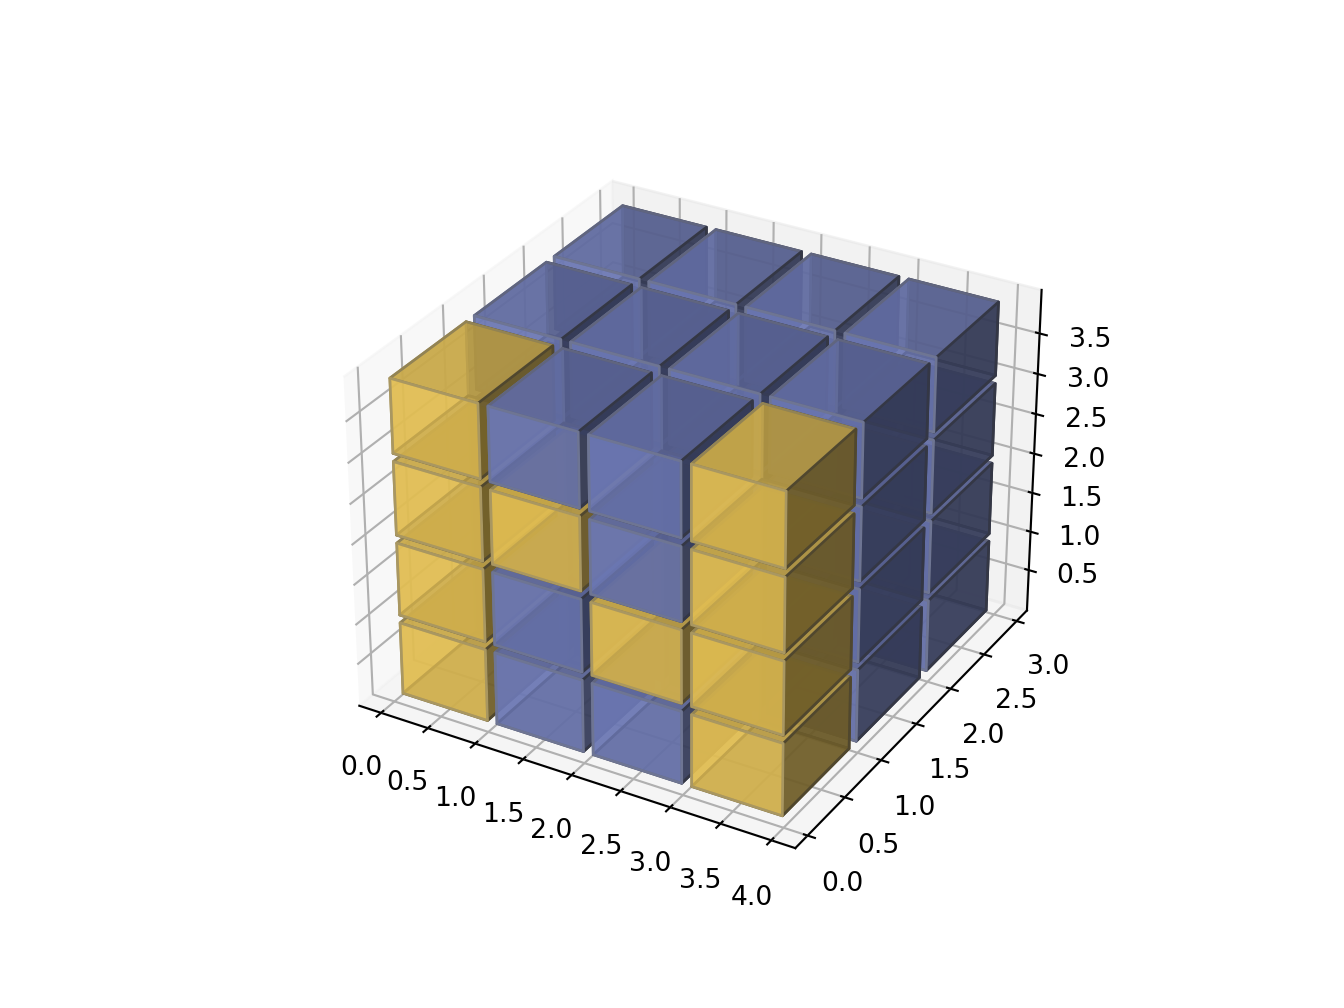
6.6 Opaque cubicles
Python
import numpy as np
import matplotlib.pyplot as plt
from mpl_toolkits.mplot3d import Axes3D

def make_ax(grid=False):
    fig = plt.figure()
    ax = fig.gca(projection='3d')
    ax.set_xlabel("x")
    ax.set_ylabel("y")
    ax.set_zlabel("z")
    ax.grid(grid)
    return ax

filled = np.array([
    [[1, 0, 1], [0, 0, 1], [0, 1, 0]],
    [[0, 1, 1], [1, 0, 0], [1, 0, 1]],
    [[1, 1, 0], [1, 1, 1], [0, 0, 0]]
])

ax = make_ax(True)
ax.voxels(filled, edgecolors='gray')
plt.show()