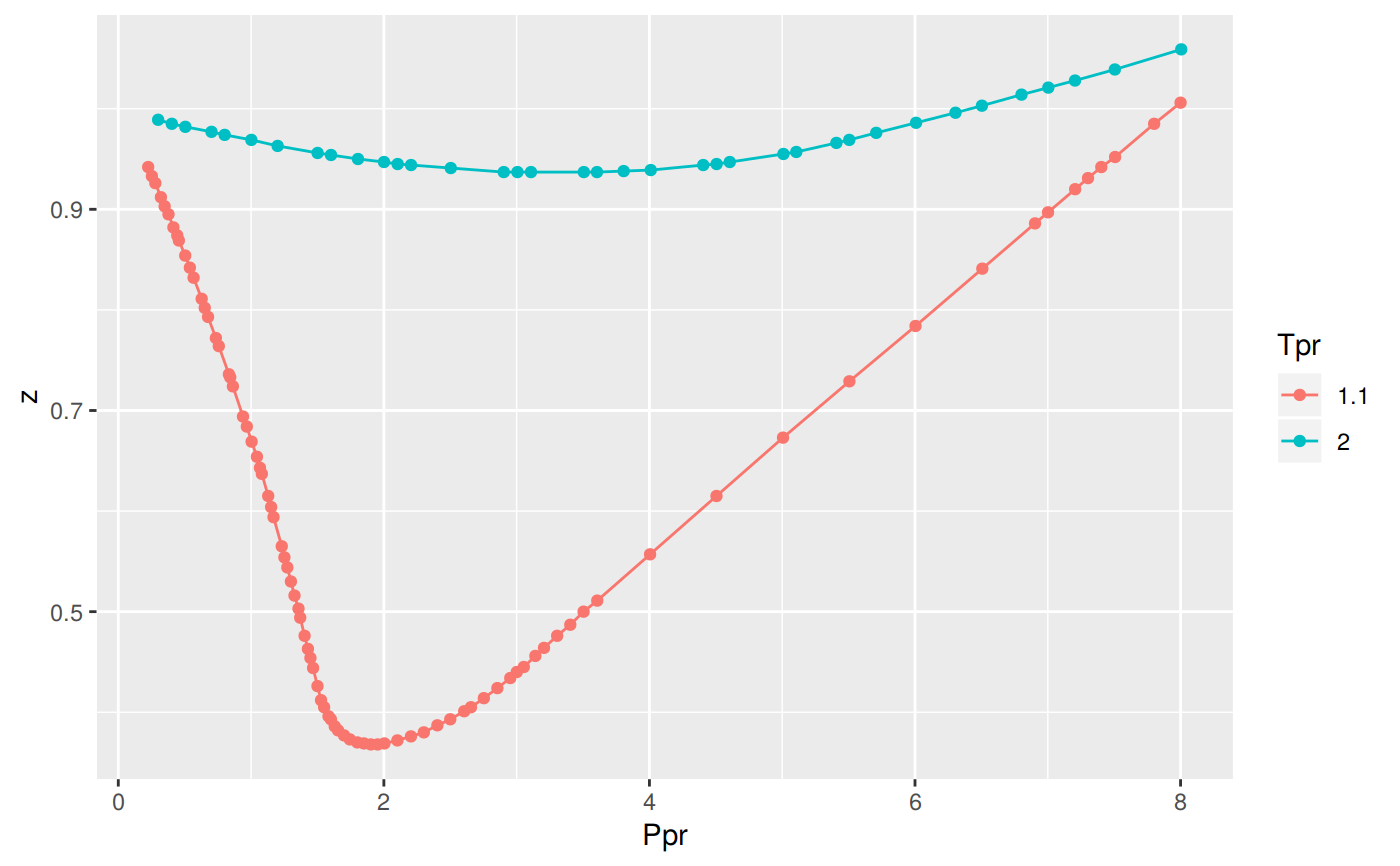
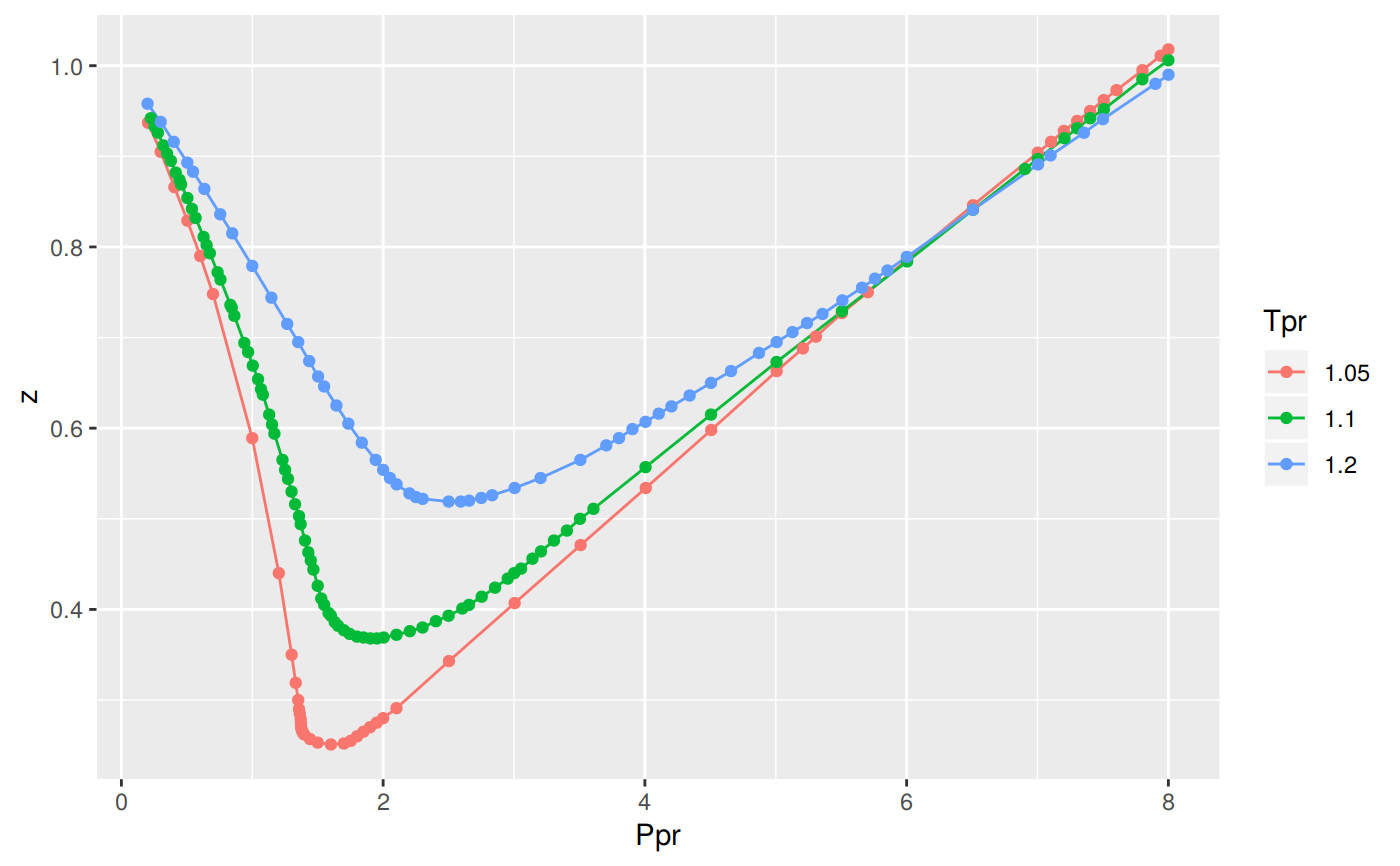
Plot shows the digitized isotherm of the Standing-Katz chart
multiplotStandingKatz(tpr = NULL, pprRange = "lp", ...)
Arguments
| tpr |
a vector of one of multiple Pseudo-reduced temperatures |
| pprRange |
Takes one of two values: "lp": low pressure, or "hp".
Default: "lp" |
| ... |
additional parameters |
Examples