Read file with readings from Standing-Katz chart, create data file and plot
Source:R/Standing-Katz.R
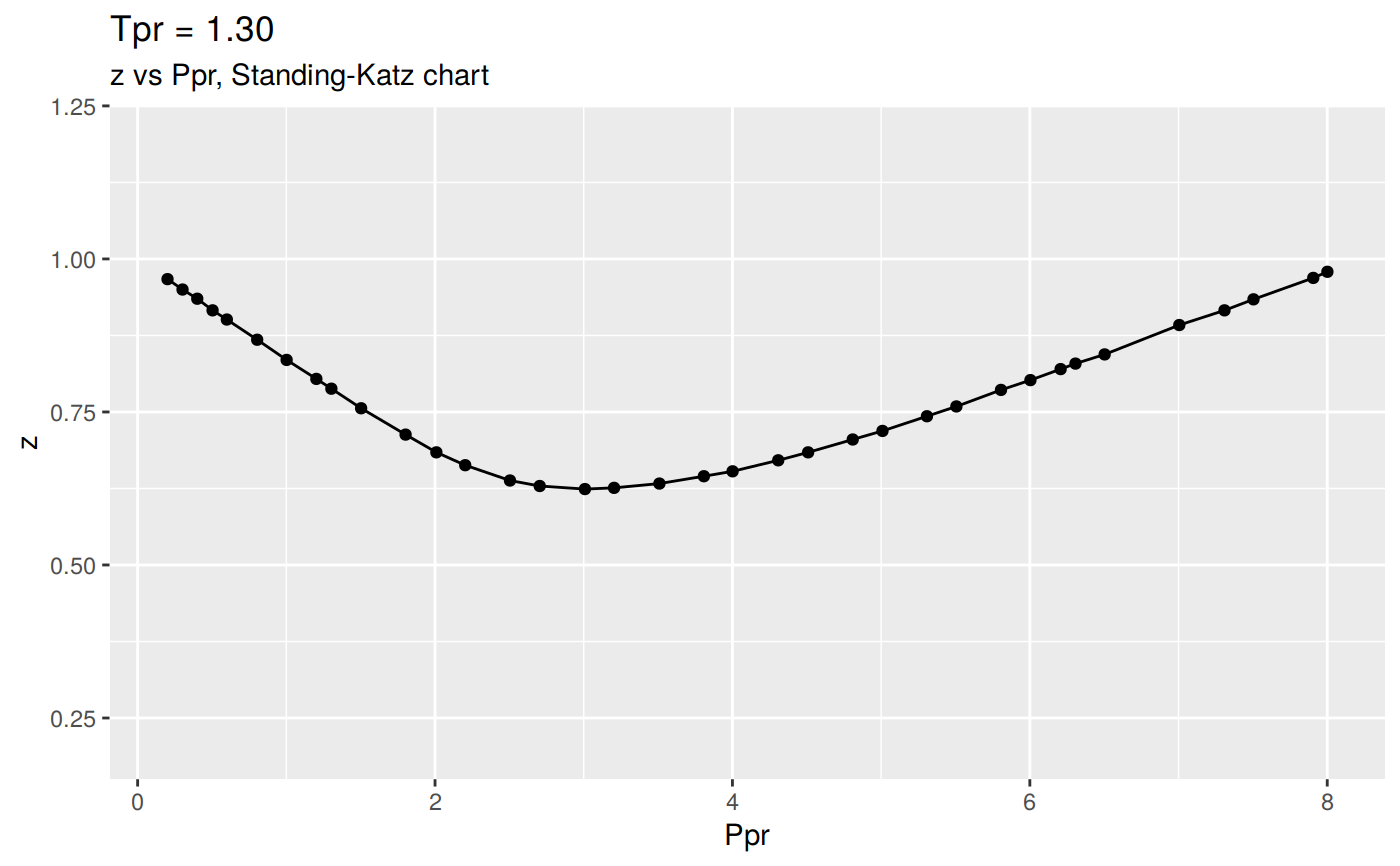
getStandingKatzCurve.RdRead a .txt file that was created from readings of the Standing-Katz chart, then convert it to a .rda file and plot the curve for given Tpr. If no values are supplied, the function will plot the SK curve at Tpr=1.30, low Ppr.
getStandingKatzCurve(tpr = 1.3, pprRange = "lp", tolerance = 0.01,
  toView = FALSE, toSave = FALSE, toPlot = TRUE, ylim = c(0.2,
  1.2))
Arguments
| tpr | Pseudo-reduced temperature curve in SK chart |
|---|---|
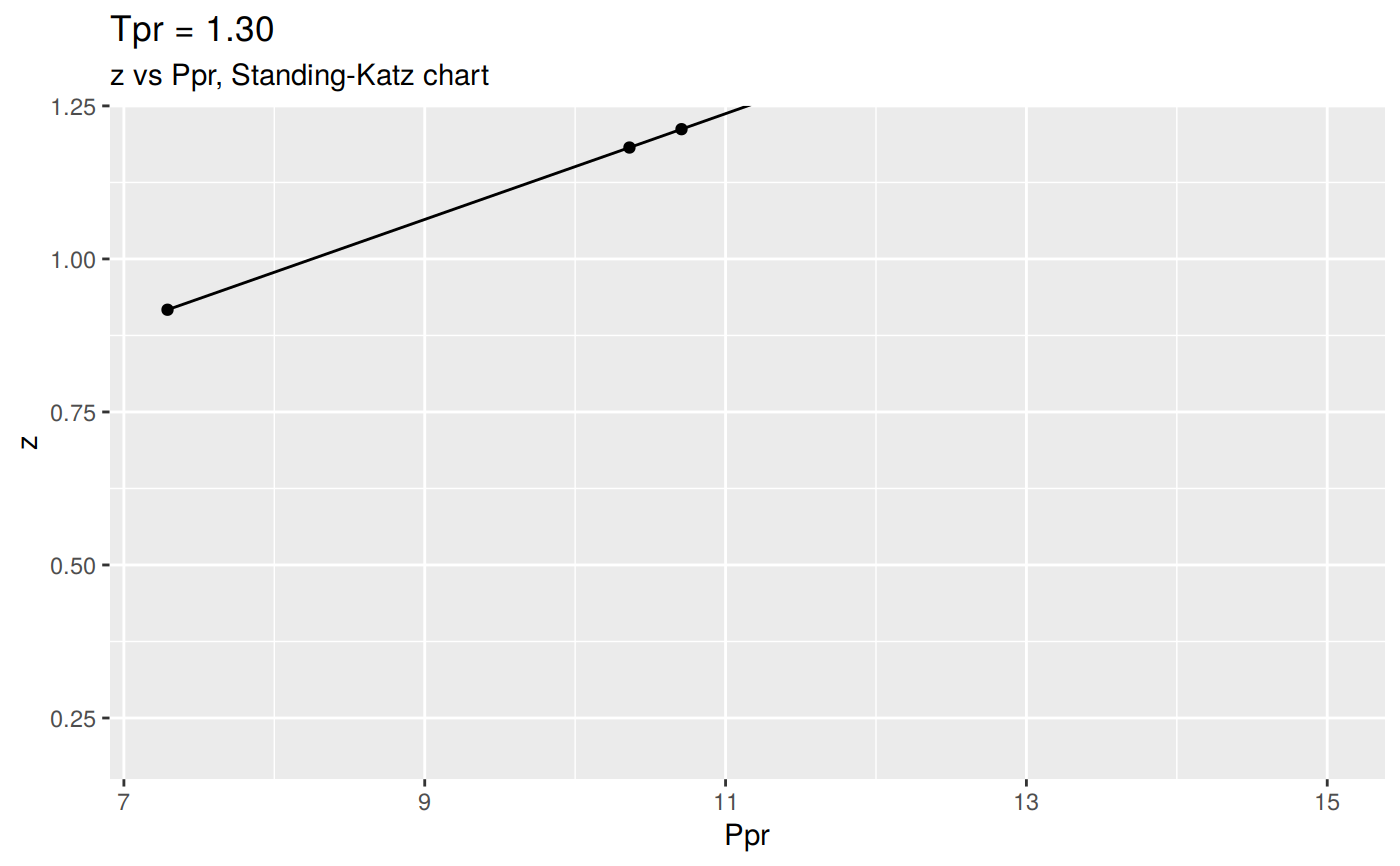
| pprRange | Takes one of two values: "lp": low pressure, or "hp" for high pressure |
| tolerance | rounding tolerance to avoid rounding readings that are in the middle of the grid. "tolerance" adds flexibility in deciding point closeness. Default value is 0.01. |
| toView | set to FALSE to prevent visualizing the dataframe |
| toSave | set to FALSE to indicate if the .rda file will not be saved to disk |
| toPlot | set to FALSE to indicate the dataset will not be plotted |
| ylim | minimum (0.2) and maximum (1.2) limits for the y-scale |
Examples
# get SK curve for low-pressure chart
getStandingKatzCurve()# get SK curve for high-pressure chart
getStandingKatzCurve(tpr = 1.3, pprRange = 'hp', toView = FALSE, toSave = FALSE)