27 Understanding the most commonly used image file formats
Anybody who is making figures for data visualization will eventually have to know a few things about how figures are stored on the computer. There are many different image file formats, and each has its own set of benefits and disadvantages. Choosing the right file format and the right workflow can alleviate many figure-preparation headaches.
My own preference is to use pdf for high-quality publication-ready files and generally whenever possible, png for online documents and other scenarios where bitmap graphics are required, and jpeg as the final resort if the png files are too large. In the following, I explain the key differences between these file formats and their respective benefits and drawbacks.
27.1 Bitmap and vector graphics
The most important difference between the various graphics formats is whether they are bitmap or vector (Table 27.1). Bitmaps or raster graphics store the image as a grid of individual points (called pixels), each with a specified color. By contrast, vector graphics store the geometric arrangement of individual graphical elements in the image. Thus, a vector image contains information such as “there’s a black line from the top left corner to the bottom right corner, and a red line from the bottom left corner to the top right corner,” and the actual image is recreated on the fly as it is displayed on screen or printed.
| Acronym | Name | Type | Application |
|---|---|---|---|
| Portable Document Format | vector | general purpose | |
| eps | Encapsulated PostScript | vector | general purpose, outdated; use pdf |
| svg | Scalable Vector Graphics | vector | online use |
| png | Portable Network Graphics | bitmap | optimized for line drawings |
| jpeg | Joint Photographic Experts Group | bitmap | optimized for photographic images |
| tiff | Tagged Image File Format | bitmap | print production, accurate color reproduction |
| raw | Raw Image File | bitmap | digital photography, needs post-processing |
| gif | Graphics Interchange Format | bitmap | outdated for static figures, Ok for animations |
Vector graphics are also called “resolution-independent,” because they can be magnified to arbitrary size without losing detail or sharpness. See Figure 27.1 for a demonstration.
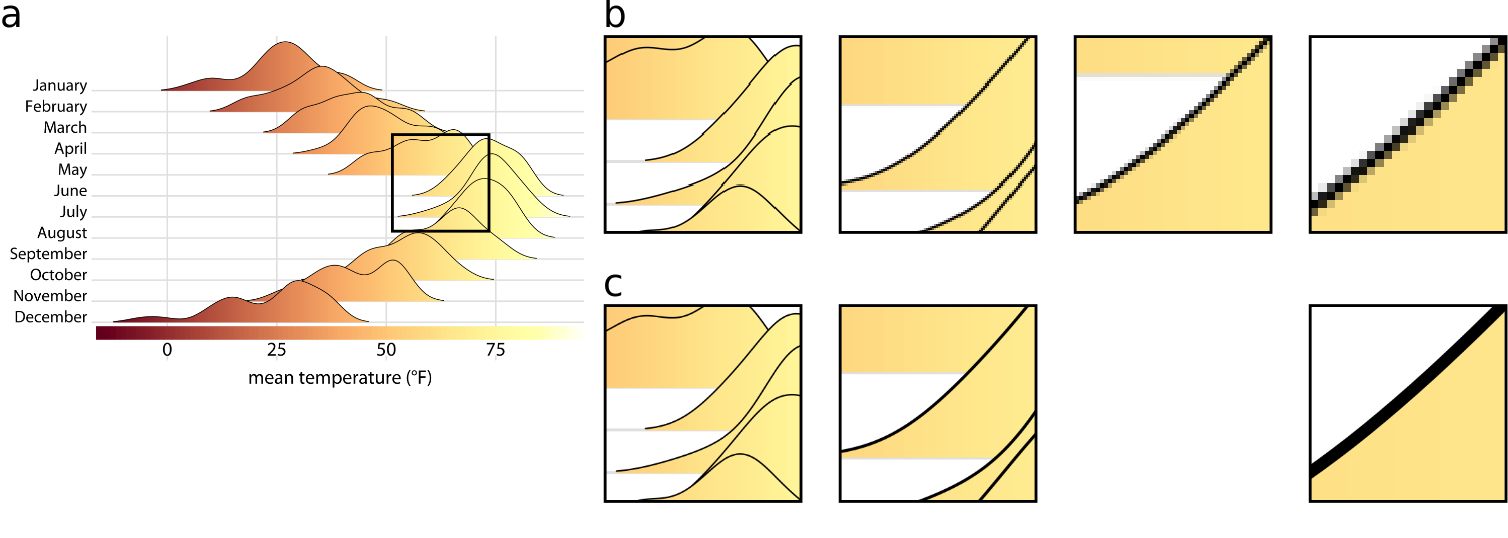
Figure 27.1: Illustration of the key difference between vector graphics and bitmaps. (a) Original image. The black square indicates the area we are magnifying in parts (b) and (c). (b) Increasing magnification of the highlighted area from part (a) when the image has been stored as a bitmap graphic. We can see how the image becomes increasingly pixelated as we zoom in further. (c) Increasing magnification of a vector representation of the image. The image maintains perfect sharpness at arbitrary magnification levels.
Vector graphics have two downsides that can and often do cause trouble in real-world applications. First, because vector graphics are redrawn on the fly by the graphics program with which they are displayed, it can happen that there are differences in how the same graphic looks in two different programs, or on two different computers. This problem occurs most frequently with text, for example when the required font is not available and the rendering software substitutes a different font. Font substitutions will typically allow the viewer to read the text as intended, but the resulting image rarely looks good. There are ways to avoid these problems, such as outlining or embedding all fonts in a pdf file, but they may require special software and/or special technical knowledge to achieve. By contrast, bitmap images will always look the same.
Second, for very large and/or complex figures, vector graphics can grow to enormous file sizes and be slow to render. For example, a scatter plot of millions of data points will contain the x and y coordinates of every individual point, and each point needs to be drawn when the image is rendered, even if points overlap and/or are hidden by other graphical elements. As a consequence, the file may be many megabytes in size, and it may take the rendering software some time to display the figure. When I was a postdoc in the early 2000s, I once created a pdf file that at the time took almost an hour to display in the Acrobat reader. While modern computers are much faster and rendering times of many minutes are all but unheard of these days, even a rendering time of a few seconds can be disruptive if you want to embed your figure into a larger document and your pdf reader grinds to a halt every time you display the page with that one offending figure. Of course, on the flip side, simple figures with only a small number of elements (a few data points and some text, say) will often be much smaller as vector graphics than as bitmaps, and the viewing software may even render such figures faster than it would the corresponding bitmap images.
27.2 Lossless and lossy compression of bitmap graphics
Most bitmap file formats employ some form of data compression to keep file sizes manageable. There are two fundamental types of compression: lossless and lossy. Lossless compression guarantees that the compressed image is pixel-for-pixel identical to the original image, whereas lossy compression accepts some image degradation in return for smaller file sizes.
To understand when using either lossless or lossy compression is appropriate, it is helpful to have a basic understanding of how these different compression algorithms work. Let’s first consider lossless compression. Imagine an image with a black background, where large areas of the image are solid black and thus many black pixels appear right next to each other. Each black pixel can be represented by three zeroes in a row: 0 0 0, representing zero intensities in the red, green, and blue color channels of the image. The areas of black background in the image correspond to thousands of zeros in the image file. Now assume somewhere in the image are 1000 consecutive black pixels, corresponding to 3000 zeros. Instead of writing out all these zeros, we could store simply the total number of zeros we need, e.g. by writing 3000 0. In this way, we have conveyed the exact same information with only two numbers, the count (here, 3000) and the value (here, 0). Over the years, many clever tricks along these lines have been developed, and modern lossless image formats (such as png) can store bitmap data with impressive efficiency. However, all lossless compression algorithms perform best when images have large areas of uniform color, and therefore Table 27.1 lists png as optimized for line drawings.
Photographic images rarely have multiple pixels of identical color and brightness right next to each other. Instead they have gradients and other somewhat regular patterns on many different scales. Therefore, lossless compression of these images often doesn’t work very well, and lossy compression has been developed as an alternative. The key idea of lossy compression is that some details in an image are too subtle for the human eye, and those can be discarded without obvious degradation in the image quality. For example, consider a gradient of 1000 pixels, each with a slightly different color value. Chances are the gradient will look nearly the same if it is drawn with only 200 different colors and coloring every five adjacent pixels in the exact same color.
The most widely used lossy image format is jpeg (Table 27.1), and indeed many digital cameras output images as jpeg by default. Jpeg compression works exceptionally well for photographic images, and huge reductions in file size can often be obtained with very little degradation in image quality. However, jpeg compression fails when images contain sharp edges, such as created by line drawings or by text. In those cases, jpeg compression can result in very noticeable artifacts (Figure 27.2).
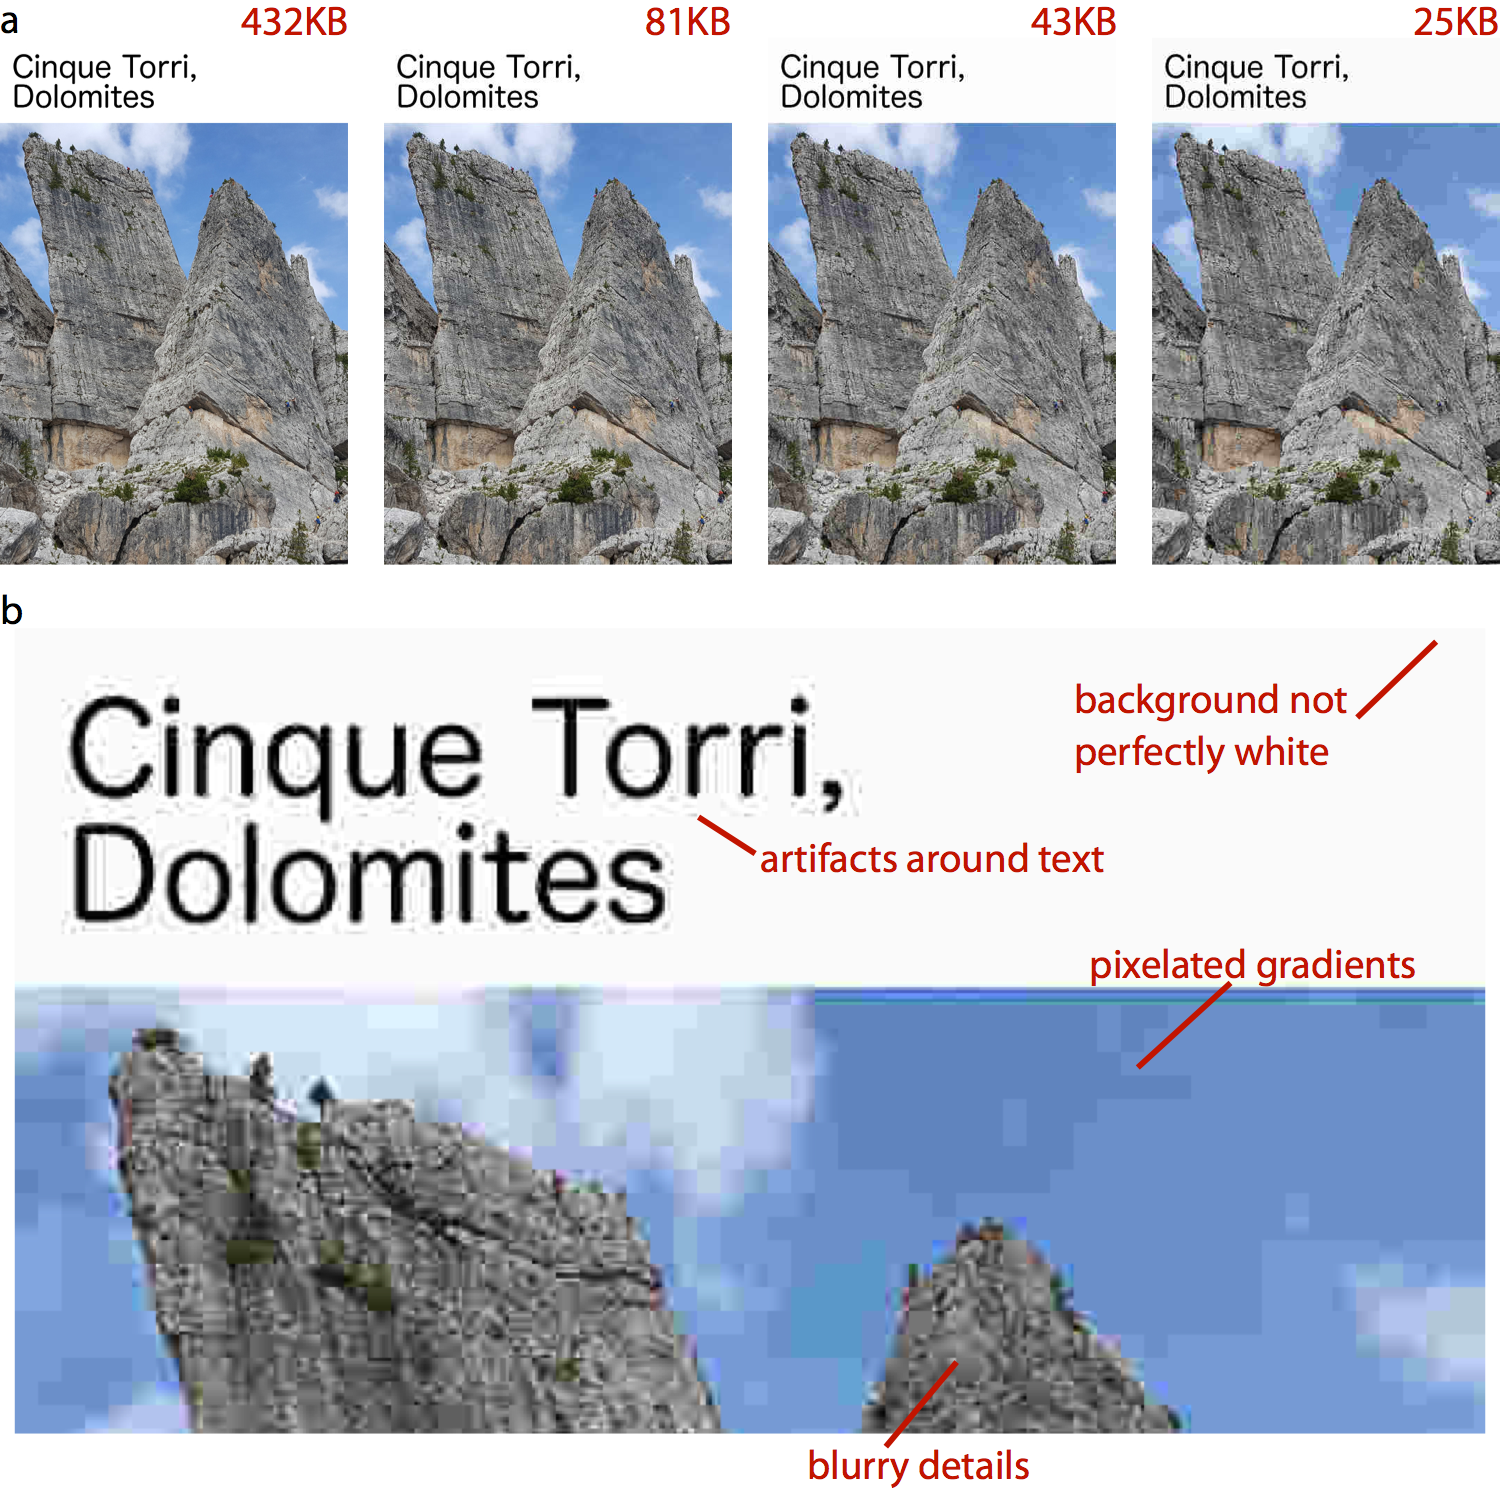
Figure 27.2: Illustration of jpeg artifacts. (a) The same image is reproduced multiple times using increasingly severe jpeg compression. The resulting file size is shown in red text above each image. A reduction in file size by a factor of 10, from 432KB in the original image to 43KB in the compressed image, results in only minor perceptible reduction in image quality. However, a further reduction in file size by a factor of 2, to a mere 25KB, leads to numerous visible artifacts. (b) Zooming in to the most highly compressed image reveals the various compression artifacts. Photo credit: Claus O. Wilke
Even if jpeg artifacts are sufficiently subtle that they are not immediately visible to the naked eye they can cause trouble, for example in print production. Therefore, it is a good idea to avoid the jpeg format whenever possible. In particular, you should avoid it for images containing line drawings or text, as is the case for data visualizations or screen shots. The appropriate format for those images is png or tiff. I use the jpeg format exclusively for photographic images. And if an image contains both photographic elements and line drawings or text, you should still use png or tiff. The worst case scenario with those file formats is that your image files grow large, whereas the worst case scenario with jpeg is that your final product looks ugly.
27.3 Converting between image formats
It is generally possible to convert any image format into any other image format. For example, on a Mac, you can open an image with Preview and then export to a number of different formats. In this process, though, important information can get lost, and information is never regained. For example, after saving a vector graphic into a bitmap format, e.g. a pdf file as a jpeg, the resolution independence that is a key feature of the vector graphic has been lost. Conversely, saving a jpeg image into a pdf file does not magically turn the image into a vector graphic. The image will still be a bitmap image, just stored inside the pdf file. Similarly, converting a jpeg file into a png file does not remove any artifacts that may have been introduced by the jpeg compression algorithm.
It is therefore a good rule of thumb to always store the original image in the format that maintains maximum resolution, accuracy, and flexibility. Thus, for data visualizations, either create your figure as pdf and then convert into png or jpg when necessary, or alternatively store as high-resolution png. Similarly, for images that are only available as bitmaps, such as digital photographs, store them in a format that doesn’t use lossy compression, or if that can’t be done, compress as little as possible. Also, store the image in as high a resolution as possible, and downscale when needed.