Chapter 3 Example datasets
3.1 Edgar Anderson’s Iris Data
In R:
library(BiocStyle)
data(iris)
From the iris manual page:
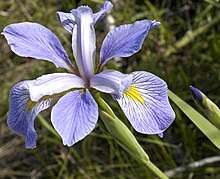
This famous (Fisher’s or Anderson’s) iris data set gives the measurements in centimeters of the variables sepal length and width and petal length and width, respectively, for 50 flowers from each of 3 species of iris. The species are Iris setosa, versicolor, and virginica.


library(DT)
datatable(iris)
For more details, see ?iris.
3.2 Motor Trend Car Road Tests
In R
data(mtcars)From the ?mtcars manual page:
The data was extracted from the 1974 Motor Trend US magazine, and comprises fuel consumption and 10 aspects of automobile design and performance for 32 automobiles (1973-74 models).
datatable(mtcars)For more details, see ?mtcars.
3.3 Sub-cellular localisation
The hyperLOPIT2015 data is used to demonstrate t-SNE and its
comparison to PCA. These data provide sub-cellular localisation of
proteins in Mouse E14TG2a embryonic stem cells, as published
in Christoforou et al. (2016).
The data comes as an MSnSet object from the Biocpkg("MSnbase")
package, specifically developed for such quantitative proteomics
data. Alternatively, comma-separated files containing a somehow
simplified version of the data can also be
found here.
These data are only used to illustrate some concepts and are not loaded and used directly to avoid installing numerous dependencies.
They are available through the Bioconductor project and can be installed with
# source("http://www.bioconductor.org/biocLite.R")
BiocManager::install(c("MSnbsase", "pRoloc")) ## software
BiocManager::install("pRolocdata") ## date
3.4 The diamonds data
The diamonds data ships with the ggplot2 package and
predict the price (in US dollars) of about 54000 round cut diamonds.
In R:
library("ggplot2")## Registered S3 methods overwritten by 'ggplot2':
## method from
## [.quosures rlang
## c.quosures rlang
## print.quosures rlangdata(diamonds)datatable(diamonds)## Warning in instance$preRenderHook(instance): It seems your data is too
## big for client-side DataTables. You may consider server-side processing:
## https://rstudio.github.io/DT/server.htmlSee also ?diamonds.
3.5 The Sonar data
The Sonar data from the mlbench package can be used
to train a classifer to recognise mines from rocks using sonar
data. The data is composed to 60 features representing the energy
within a particular frequency band.
In R:
library("mlbench")
data(Sonar)datatable(Sonar)See also ?Sonar.
3.6 Housing Values in Suburbs of Boston
The Boston data from the MASS provides the median
value of owner-occupied homes (medv) in $1000s as well as 13 other
features for 506 homes in Boston.
In R:
library("MASS")
data(Boston)datatable(Boston)See also ?Boston.
3.7 Customer churn
This data from the C50 package and distributes a training set with 3333 samples and a test set containing 1667 samples of customer attrition.
In R:
library("C50")
data(churn)
dim(churnTrain)
## [1] 3333 20dim(churnTest)## [1] 1667 20datatable(churnTrain)